
When it comes to day trading, having the right tools and strategies is essential for success. Technical indicators are one of the most valuable resources that day traders rely on to gain insights into market dynamics and generate buy and sell signals.
In this article, we will explore some of the best technical indicators for day trading that can help you make more informed trading decisions. By understanding how these indicators work and incorporating them into your trading strategy, you can increase your chances of achieving success in the fast-paced world of day trading.

Key Takeaways:
- Technical indicators are essential tools for day traders, providing insights into market dynamics and generating buy and sell signals.
- Some of the best technical indicators for day trading include On-Balance-Volume (OBV), Accumulation/Distribution (A/D) line, Average Directional Index (ADX), Aroon oscillator, Moving Average Convergence Divergence (MACD), Relative Strength Index (RSI), Stochastic oscillator, VWAP, and moving averages.
- It’s important for day traders to find the indicators that work best for their trading strategies and to understand how to interpret and use them effectively.
- Implementing a combination of these indicators and practicing on a trading demo account can improve the chances of success in day trading.
- Stay alert and adapt your trading strategy based on market conditions and the signals provided by these technical indicators.
On-Balance Volume (OBV)
The On-Balance Volume (OBV) indicator is a valuable tool for volume analysis in day trading. It measures the positive and negative flow of volume in a security over time, providing insights into buying and selling pressure. Traders use the OBV indicator to confirm trends and identify potential reversals.
When the OBV rises, it indicates buying pressure, suggesting that the security is being accumulated. Conversely, a falling OBV suggests selling pressure and distribution of the security. By analyzing the OBV in conjunction with price movements, day traders can identify divergences and potential trend reversals.
“The OBV indicator provides valuable insights into volume dynamics, giving traders an edge in understanding market sentiment and spotting opportunities.”
By monitoring the OBV, day traders can gain a better understanding of market dynamics and make more informed trading decisions. The OBV indicator is particularly useful when combined with other technical indicators, such as moving averages or trendlines, to confirm trends and validate potential trade setups.
Key Features of the OBV Indicator:
- Trend Confirmation: Rising OBV confirms an uptrend while falling OBV confirms a downtrend.
- Divergence Detection: Divergences between price and OBV can indicate potential trend reversals.
- Buy and Sell Signals: OBV crossovers with moving averages or trendlines can generate buy or sell signals.
To illustrate the concept of OBV, consider the following example:
| Date | Price | Volume | OBV |
|---|---|---|---|
| Day 1 | 100 | 1000 | 1000 |
| Day 2 | 102 | 800 | 1800 |
| Day 3 | 101 | 1500 | 3300 |
| Day 4 | 98 | 1200 | 2100 |
| Day 5 | 105 | 2000 | 4100 |
In this example, the OBV starts at 1000 and increases with each day of positive volume (Day 2 and Day 3) and decreases on days with negative volume (Day 4). Traders can use the OBV to identify the overall accumulation or distribution of security and make trading decisions accordingly.
Summary
The On-Balance Volume (OBV) indicator is a powerful tool for volume analysis in day trading. By measuring the flow of volume in a security over time, provides insights into buying and selling pressure. Traders can use the OBV indicator to confirm trends, identify divergences, and generate potential buy or sell signals. Incorporating the OBV into their trading strategies, day traders can improve their chances of success in the dynamic world of day trading.
Accumulation/Distribution (A/D) Line
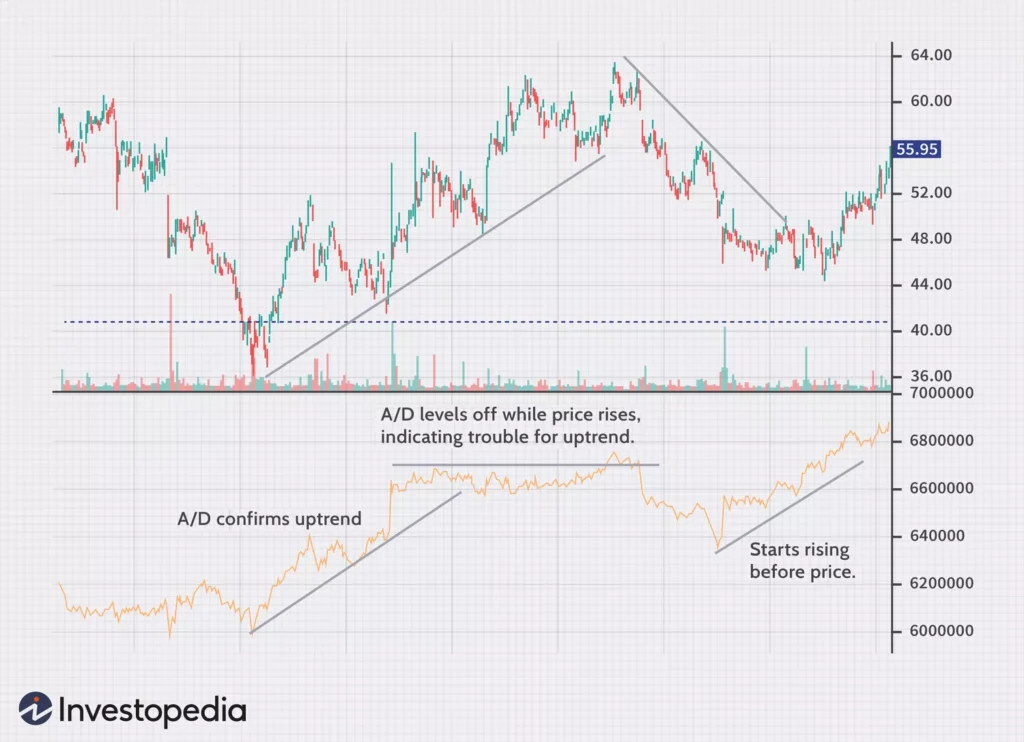
The Accumulation/Distribution (A/D) line is an indispensable technical indicator for day traders. It plays a crucial role in measuring the volume flow in and out of a security, providing valuable insights into market dynamics and money flow in day trading. The A/D line takes into account the trading range and closing price, allowing traders to gauge buying and selling pressure in the market.
A rising A/D line indicates buying interest and suggests that money is flowing into the security, potentially signaling an uptrend. Conversely, a falling A/D line indicates selling pressure, indicating that money is flowing out of the security, potentially signaling a downtrend. By analyzing the changes in the A/D line, day traders can identify shifts in market sentiment and make informed trading decisions.
Divergences between the price and A/D line are also useful in day trading. When the price of a security is moving in a certain direction while the A/D line is moving in the opposite direction, it may be an indication of an impending trend reversal. This can serve as a valuable signal for day traders to adjust their positions and capitalize on potential market reversals.
Illustrative Example
To better understand the concept, let’s consider the case of XYZ stock. The A/D line for XYZ stock shows a consistent rise over a specific period, indicating strong buying pressure and a positive money flow. In contrast, the price of the stock has been declining during the same period, creating a divergence between the price and the A/D line. This divergence suggests that the downtrend in price may be losing momentum and a potential trend reversal or price correction could be imminent.
| Date | A/D Line | Price |
|---|---|---|
| Day 1 | 200 | $10.00 |
| Day 2 | 250 | $9.50 |
| Day 3 | 300 | $9.00 |
| Day 4 | 350 | $8.50 |
| Day 5 | 400 | $8.00 |
In the example above, as the A/D line keeps rising, the price of XYZ stock declines. This suggests that while investors are accumulating shares, driving up the A/D line, the price is under pressure due to selling activity. The divergence between the rising A/D line and the falling price indicates a potential buying opportunity for day traders, as the downtrend may be losing steam. By considering such divergences between the A/D line and price, day traders can enhance their trading strategies and make better-informed decisions.
Average Directional Index (ADX)
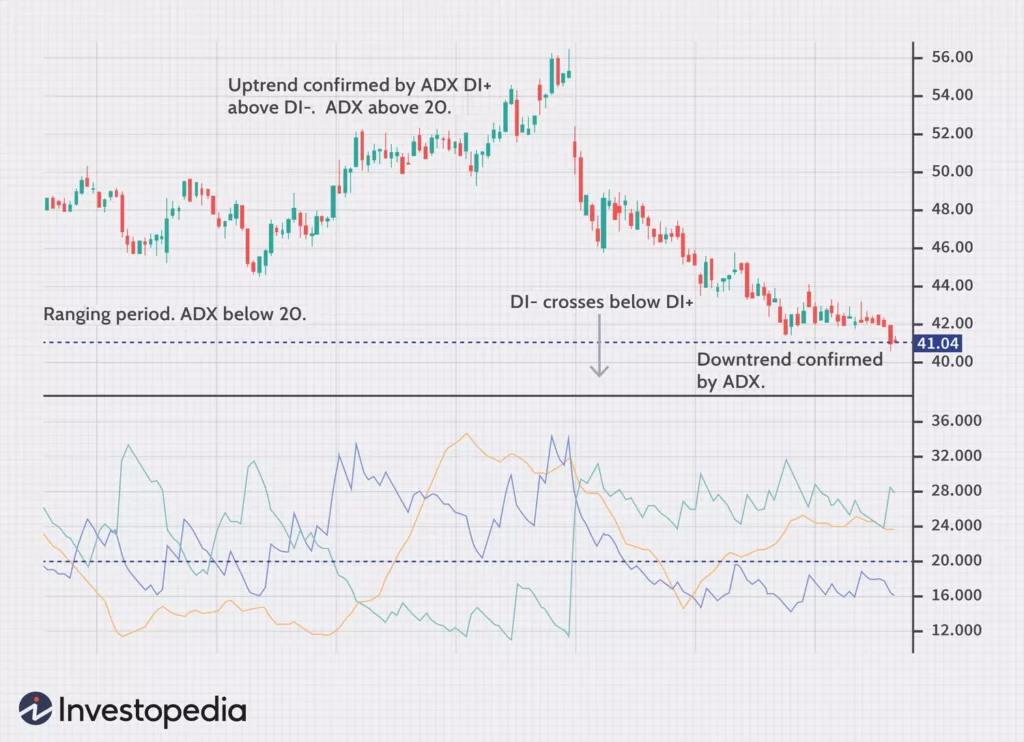
The Average Directional Index (ADX) is a powerful technical indicator that measures the strength and momentum of a trend in day trading. It helps traders identify the strength of a trend and whether it is worth trading or not. The ADX is particularly useful when combined with other indicators, providing confirmation of the trend and potential reversal points.
The ADX value ranges from 0 to 100. A high ADX value, typically above 25 or 30, indicates a strong trend, whether it’s bullish or bearish. This indicates that the market is trending and there is a high probability of continued price movement in the same direction. On the other hand, a low ADX value, usually below 20, suggests a weak or non-trending market, indicating that it may be better to avoid trading in such conditions.
When using the ADX in day trading, it’s important to understand that the indicator does not provide information about the direction of the trend, only its strength. To determine the direction, traders often combine the ADX with other indicators, such as moving averages or trendlines, to confirm the trend and identify potential entry or exit points.
Key takeaways:
- The ADX measures the strength and momentum of a trend in day trading.
- A high ADX value indicates a strong trend, while a low ADX value suggests a weak or non-trending market.
- The ADX is often used in combination with other indicators to confirm the direction of the trend and identify potential reversals.
By understanding and utilizing the Average Directional Index (ADX) as a trend indicator, day traders can assess the strength of a trend and make informed decisions. It is an essential tool for analyzing market dynamics and identifying potential trading opportunities. Combining the ADX with other indicators can enhance the accuracy of trend analysis, increasing the chances of success in day trading.
Aroon Oscillator
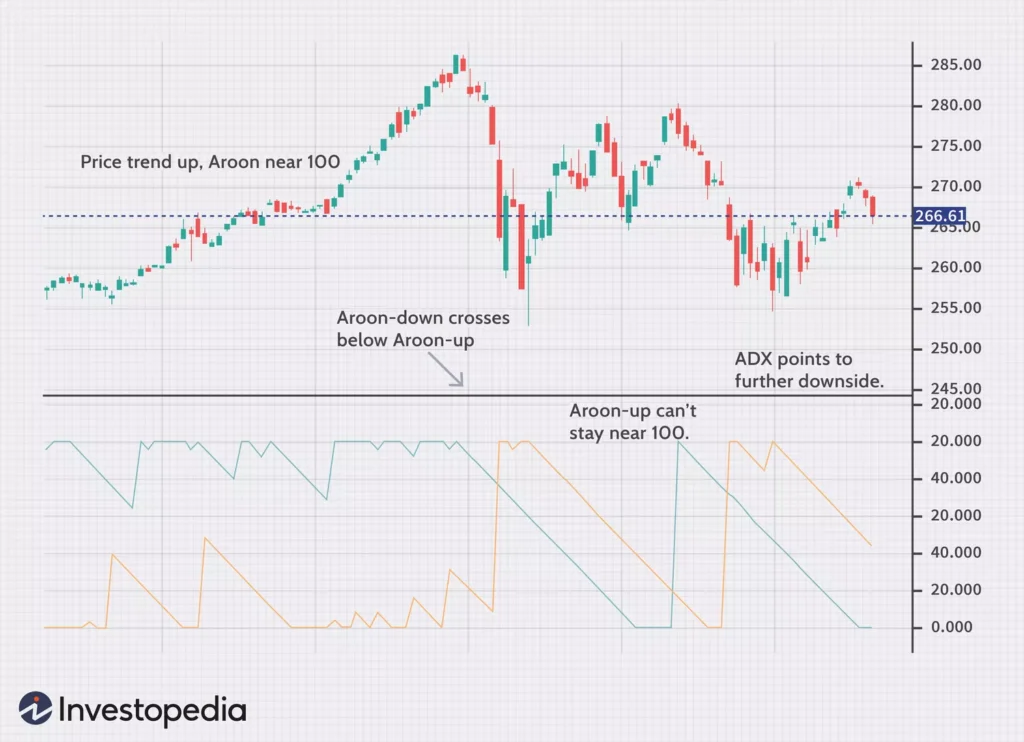
The Aroon Oscillator is a powerful technical indicator that aids in trend identification and new highs and lows in day trading. It consists of two lines, the Aroon Up line and the Aroon Down line, which measure and compare the time it takes for a security to reach new highs and lows.
The Aroon Oscillator is particularly useful for day traders who want to identify and confirm trends, as well as potential trend reversals. By examining the relationship between the two lines, traders can gather valuable insights into the strength and direction of the market.
How it Works
The Aroon Oscillator operates on a scale of -100 to +100, with zero as the central level. The Aroon Up line calculates the number of periods since the security last reached a new high, while the Aroon Down line calculates the number of periods since the security last reached a new low. As the Aroon Up line approaches 100, it indicates the security is hitting new highs, while the Aroon Down line approaching 100 suggests the security is reaching new lows.
When the Aroon Up line crosses above the Aroon Down line, it signals a potential trend change, indicating the emergence of a new bullish trend. Conversely, when the Aroon Down line crosses above the Aroon Up line, it suggests a possible bearish trend reversal.
| Scenario | Aroon Up | Aroon Down | Aroon Oscillator |
|---|---|---|---|
| Strong Uptrend | 100 | 0 | 100 |
| Mild Uptrend | 70 | 0 | 70 |
| No Clear Trend | 50 | 50 | 0 |
| Mild Downtrend | 0 | 70 | -70 |
| Strong Downtrend | 0 | 100 | -100 |
The Aroon Oscillator provides traders with crucial information about the current trend and potential reversals. It helps them make timely and informed decisions regarding entry and exit points, allowing for more successful trades.

Moving Average Convergence Divergence (MACD)
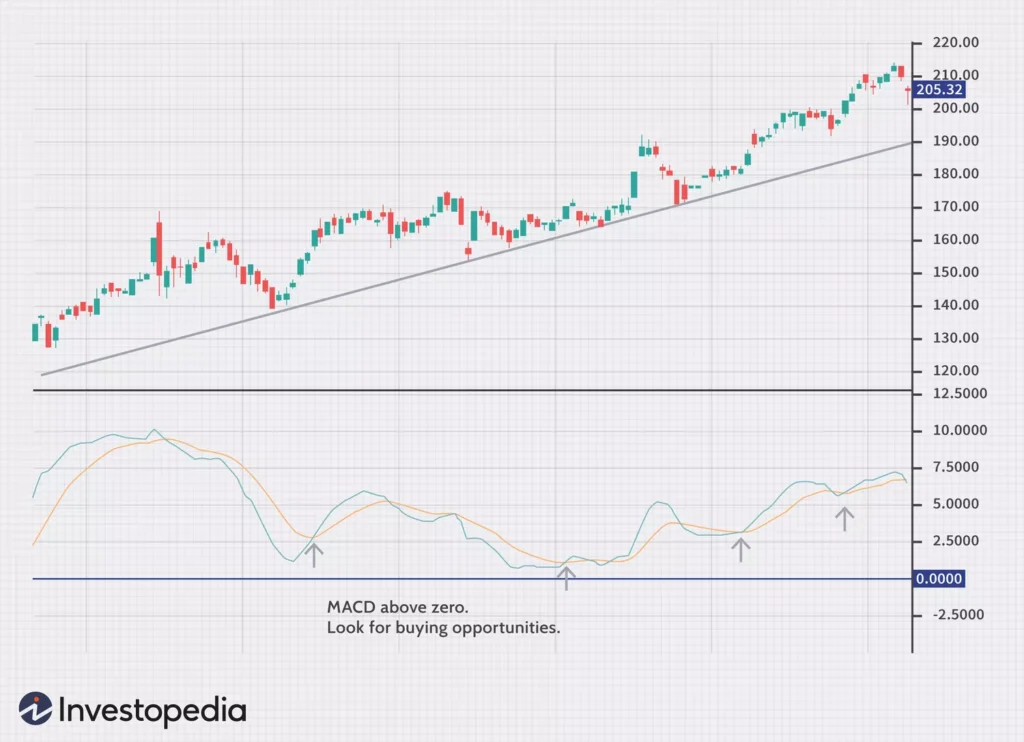
The Moving Average Convergence Divergence (MACD) is a powerful momentum indicator frequently used in day trading. By utilizing moving averages, the MACD identifies both trend direction and momentum.
The MACD consists of two lines: the MACD line and the signal line. The MACD line represents the difference between two moving averages, while the signal line is a moving average of the MACD line. It is the interaction between these lines that generates buy or sell signals.
When the MACD line crosses above the signal line, a bullish signal is generated, indicating the potential start of an uptrend. Conversely, when the MACD line crosses below the signal line, a bearish signal is generated, suggesting the potential start of a downtrend.
Traders also use the MACD to identify divergences, which occur when the price and the MACD line move in opposite directions. Divergences can be an indication of potential trend reversals, providing traders with valuable insights for their decision-making process.
The MACD indicator is highly versatile and can be applied to various trading strategies. Whether used in isolation or in combination with other technical indicators, the MACD provides valuable information on trend direction, momentum, and potential reversals.
Relative Strength Index (RSI)

The Relative Strength Index (RSI) is a valuable momentum indicator that measures the magnitude and speed of price movements in the market. It is used by day traders to identify overbought and oversold conditions, as well as to gauge the strength of a trend.
The RSI ranges from 0 to 100, with readings above 70 indicating overbought conditions and readings below 30 suggesting oversold conditions. When the RSI is above 70, it suggests that the market is overextended and a price correction may be imminent. Conversely, when the RSI is below 30, it indicates that the market may be oversold and due for a rebound.
“The RSI is a valuable tool for day traders as it provides insights into the momentum and trend strength of a security.”
Traders often use divergences between price and RSI as potential signals for trend reversals. For example, if security is making lower lows while the RSI is making higher lows, it may suggest that the selling pressure is weakening and a trend reversal could occur. Conversely, if security is making higher highs while the RSI is making lower highs, it may indicate that the buying pressure is waning and a trend reversal could be imminent.
The RSI is a versatile indicator that can be used in conjunction with other technical tools to enhance trading decisions. By analyzing overbought and oversold conditions, as well as identifying momentum and trend strength, traders can gain valuable insights into market dynamics and improve their day trading strategies.

| RSI Reading | Market Condition |
|---|---|
| Above 70 | Overbought |
| Below 30 | Oversold |
Stochastic Oscillator
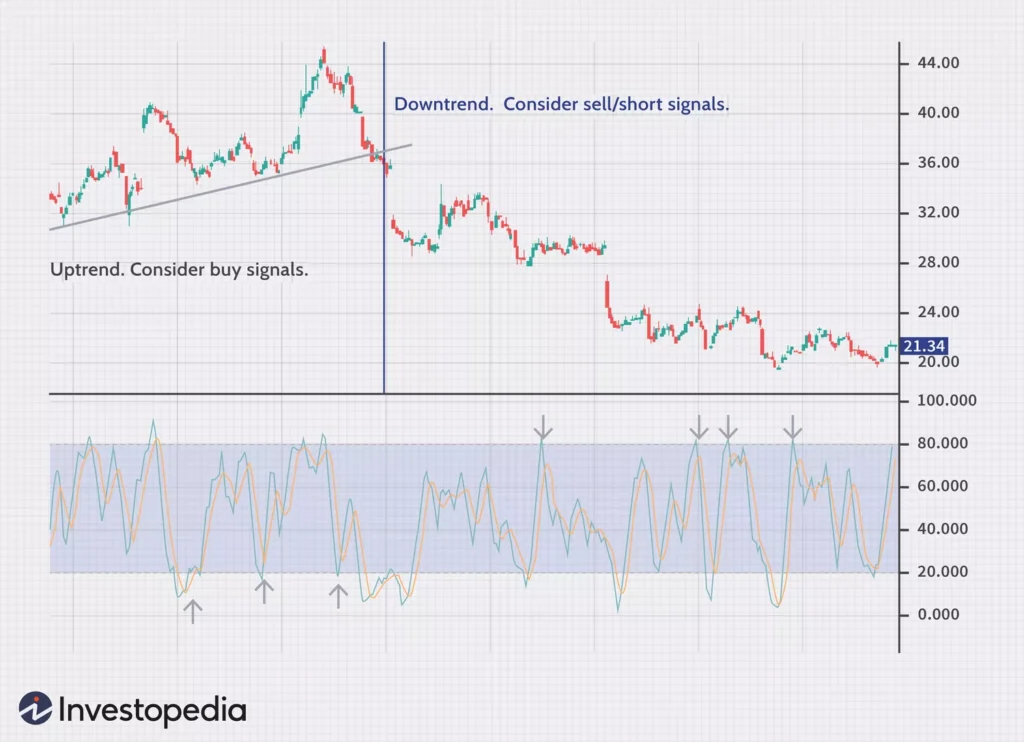
The Stochastic Oscillator is a powerful technical indicator used by day traders to measure the current price relative to its price range over a specified period. It helps identify overbought and oversold levels in the market, providing valuable insights for trading decisions.
The Stochastic Oscillator ranges from 0 to 100 and consists of two lines: the %K line and the %D line. The %K line represents the current price position in relation to the price range, while the %D line is a moving average of the %K line.
Traders commonly use the Stochastic Oscillator to identify potential trend reversals, as overbought and oversold levels can signal a change in market sentiment. Values above 80 indicate overbought conditions, suggesting that the price may be due for a correction. Conversely, levels below 20 indicate oversold conditions, suggesting that the price may be ripe for a bounce back.
Moreover, traders pay close attention to crossovers and divergences in the Stochastic Oscillator. A bullish crossover occurs when the %K line crosses above the %D line, indicating a potential buying opportunity. On the other hand, a bearish crossover occurs when the %K line crosses below the %D line, suggesting a potential selling opportunity.
To further enhance the effectiveness of the Stochastic Oscillator, traders often combine it with other technical indicators and price action analysis. This allows for a more comprehensive assessment of market conditions and increases the probability of successful trades.
Example Stochastic Oscillator Analysis
Let’s take a look at a hypothetical example of how the Stochastic Oscillator can be utilized in price range analysis:
Stock XYZ has been experiencing a prolonged uptrend, with prices continuously making higher highs and higher lows. As a day trader, I’m interested in identifying potential overbought levels to avoid buying at the top of the trend.
Using the Stochastic Oscillator with a 14-day period, I observe that the %K line has crossed above the %D line, indicating overbought conditions. The Stochastic Oscillator reading is 84, which confirms that the price is currently in an overbought state.
Considering this information, I decide to wait for a bearish crossover or a divergence in the Stochastic Oscillator to confirm a potential trend reversal. I set alerts for these signals and continue monitoring the stock’s price action.
By incorporating the Stochastic Oscillator into their trading strategies, day traders can gain valuable insights into price range analysis, identify overbought and oversold levels, and potentially improve their trading success rates.
Stochastic Oscillator Cheat Sheet
| %K | %D | Market Condition |
|---|---|---|
| Values above 80 | N/A | Overbought |
| Values below 20 | N/A | Oversold |
| %K crosses above %D | N/A | Bullish Crossover |
| %K crosses below %D | N/A | Bearish Crossover |
Utilizing the Stochastic Oscillator in day trading can provide valuable insights into the price range analysis, helping traders identify potential overbought and oversold levels. By combining the Stochastic Oscillator with other technical indicators and strategies, traders can enhance their decision-making process and increase the likelihood of successful trades.
Volume-Weighted Average Price (VWAP)
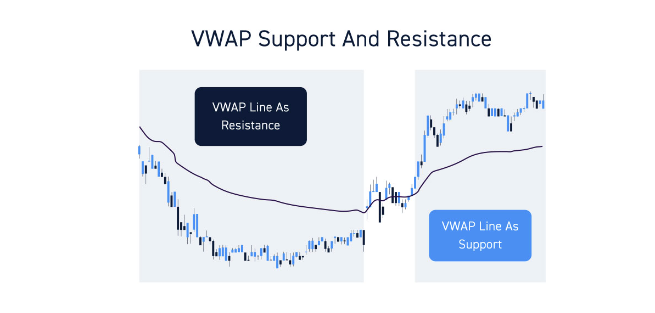
Volume-weighted Average Price (VWAP) is a widely used technical indicator in day trading that takes into account both price and trading volume. It calculates the average price of an asset over a given period and multiplies it by the trading volume over that period. VWAP is often used to determine support and resistance levels and can be a valuable tool for identifying market trends and potential trading opportunities.

When analyzing volume in day trading, the VWAP indicator provides insights into the average price at which a security has traded throughout the day. It gives greater weight to periods with higher trading volume, making it an effective indicator for determining the fair value of an asset.
The VWAP indicator is particularly useful for identifying support and resistance levels in day trading. When the price of a security is trading above the VWAP line, it indicates that the buying pressure is higher than the average price, suggesting a potential support level. Conversely, when the price is trading below the VWAP line, it suggests selling pressure and a potential resistance level.
Traders often use the VWAP indicator in conjunction with other technical indicators to confirm trading signals. For example, a breakout above the VWAP line accompanied by high trading volume can signal a strong buying opportunity, while a breakdown below VWAP with significant volume can indicate a potential selloff.
Furthermore, the VWAP indicator can also be applied to intraday trading strategies such as mean reversion and trend following. In mean reversion strategies, traders look for price deviations from the VWAP line as potential entry or exit points, expecting the price to revert back to the average. In trend following strategies, traders use the VWAP line as a reference point for identifying the overall direction of the market.
Overall, the VWAP indicator is a powerful tool for day traders, providing insights into price movements, support and resistance levels, and market trends. By incorporating the VWAP indicator into their analysis, traders can make more informed decisions and improve their chances of success in day trading.

Moving Averages
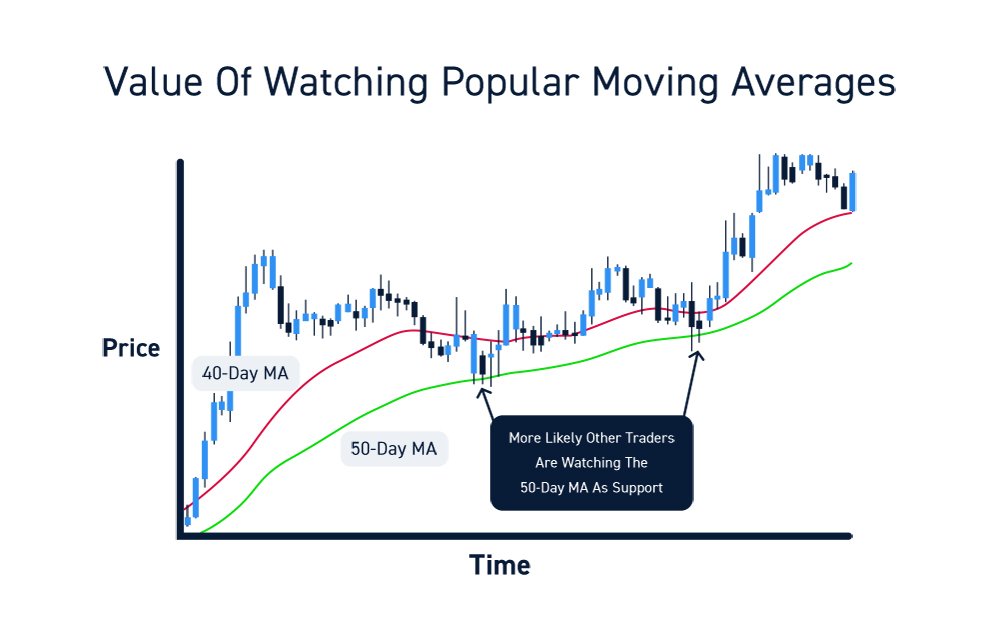
Moving averages are widely used technical indicators in day trading to identify trends and generate buy or sell signals. They provide a smoothed line that reflects the average price of an asset over a specific period, allowing traders to filter out short-term fluctuations and focus on the overall direction of the market.
There are two main types of moving averages: Simple Moving Averages (SMA) and Exponential Moving Averages (EMA). SMA calculates the average price over a specific period by simply summing up the prices and dividing them by the number of periods. On the other hand, EMA gives more weight to recent prices, making it more responsive to the latest market movements.
Traders often use the crossover of short-term and long-term moving averages as a technique to identify trend reversals. When the short-term moving average crosses above the long-term moving average, it suggests a potential bullish signal, indicating that the trend might be changing from bearish to bullish. Conversely, when the short-term moving average crosses below the long-term moving average, it indicates a potential bearish signal and suggests that the trend might be changing from bullish to bearish.
Moreover, moving averages can also act as support or resistance levels. When the price approaches a moving average from below and bounces off, it can act as a support level. Conversely, when the price approaches a moving average from above and struggles to break through, it can act as a resistance level.
Summary:
- Moving averages are popular technical indicators used in day trading to identify trends and generate buy or sell signals.
- Simple Moving Averages (SMA) calculate the average price over a specific period, while Exponential Moving Averages (EMA) give more weight to recent prices.
- Traders often use the crossover of short-term and long-term moving averages to identify trend reversals.
- Moving averages can also act as support or resistance levels.
| Indicator | Calculation | Application |
|---|---|---|
| Simple Moving Average (SMA) | Sum of prices divided by the number of periods | Trend identification and support/resistance levels |
| Exponential Moving Average (EMA) | Weighing recent prices more heavily than older ones | Responsive trend identification |
| Crossover of moving averages | Short-term moving average crossing above or below the long-term moving average | Trend reversal signals |
Conclusion
Technical indicators are essential tools for successful day trading strategies, providing traders with valuable insights into market trends and helping them make informed decisions. From On-Balance Volume (OBV) to Moving Average Convergence Divergence (MACD), these indicators offer a range of analysis techniques to enhance trading accuracy.
It is crucial for day traders to find the right combination of indicators that align with their trading strategies. Traders should also invest time in understanding how to interpret and use these indicators effectively to maximize their trading results. Practical implementation of a variety of indicators and regular practice on a trading demo account can significantly improve the chances of success in day trading.
By incorporating the best day trading indicators such as OBV, A/D line, ADX, Aroon oscillator, MACD, RSI, Stochastic oscillator, VWAP, and moving averages, traders can gain a deeper understanding of market dynamics and develop robust trading strategies. Ultimately, leveraging the power of technical indicators can lead to consistent profitability and successful day trading experiences.